SpectroPipeR - example code - functional enrichment analysis (external package)
a07_Gprofiler2_code_suggestion.RmdSpectroPipeR does not incorporate a function for functional enrichment analysis due to the existence of numerous solutions, and users may have a preference for their own approach. However, the following code example illustrates the recommended implementation of statistical results files for a functional enrichment analysis using the Gprofiler2 package. For more information, please refer to the Gprofiler R implementation and the R vignette of Gprofiler2.
Gprofiler2 code suggestion
# install gprofiler2 package
install.packages("gprofiler2")
# load packages
library(gprofiler2)
library(tidyverse)
#set working directory or create RStudio project inside your SpectroPipeR output folder
setwd("[your working directory or SpectroPipeR output folder]")
# load SpectroPipeR statistics --------------------------------------------
#path to statistical_analysis.csv
stats <- read_csv("[path]/statistical_analysis.csv")
# filter statistics -------------------------------------------------------
stats_filtered <- stats %>%
# filter for ≥2 peptides
filter(n>=2) %>%
# filter for FC & q-value
filter(fold_change_absolute >= 2 & p.fdr <= 0.05)
# get statistical comparisons ---------------------------------------------
comparison <- unique(stats_filtered$slr_ratio_meta)
# generate output folder --------------------------------------------------
dir.create("gprofiler_query_Results",showWarnings = F)
# perform Gprofiler analysis in a for loop over comparisons ---------------
for(i in comparison){
# filter data for comparison
grpofiler_input <- stats_filtered %>%
filter(slr_ratio_meta %in% i)
# Gene list functional enrichment.
#
# run gprofiler
# query - character vector of protein IDs
# significant - whether all or only statistically significant results should be returned.
# organism - Organism names are constructed by concatenating the first letter of the name and
# the family name. Example: human - 'hsapiens', mouse - 'mmusculus'
grpofiler_res<- gost(query = grpofiler_input$PG.ProteinGroups,
significant = T, # only statistically significant results should be returned
organism = "hsapiens" # select the right organism
)
# write grpofiler results container
write_rds(x = grpofiler_res,file = paste0("gprofiler_query_Results/",
str_replace_all(i,"/","_vs_"),".rds"))
# write grpofiler results table
write_csv(x = as_tibble(grpofiler_res$result),
file = paste0("gprofiler_query_Results/",str_replace_all(i,"/","_vs_"),".csv"))
# write grpofiler results plot
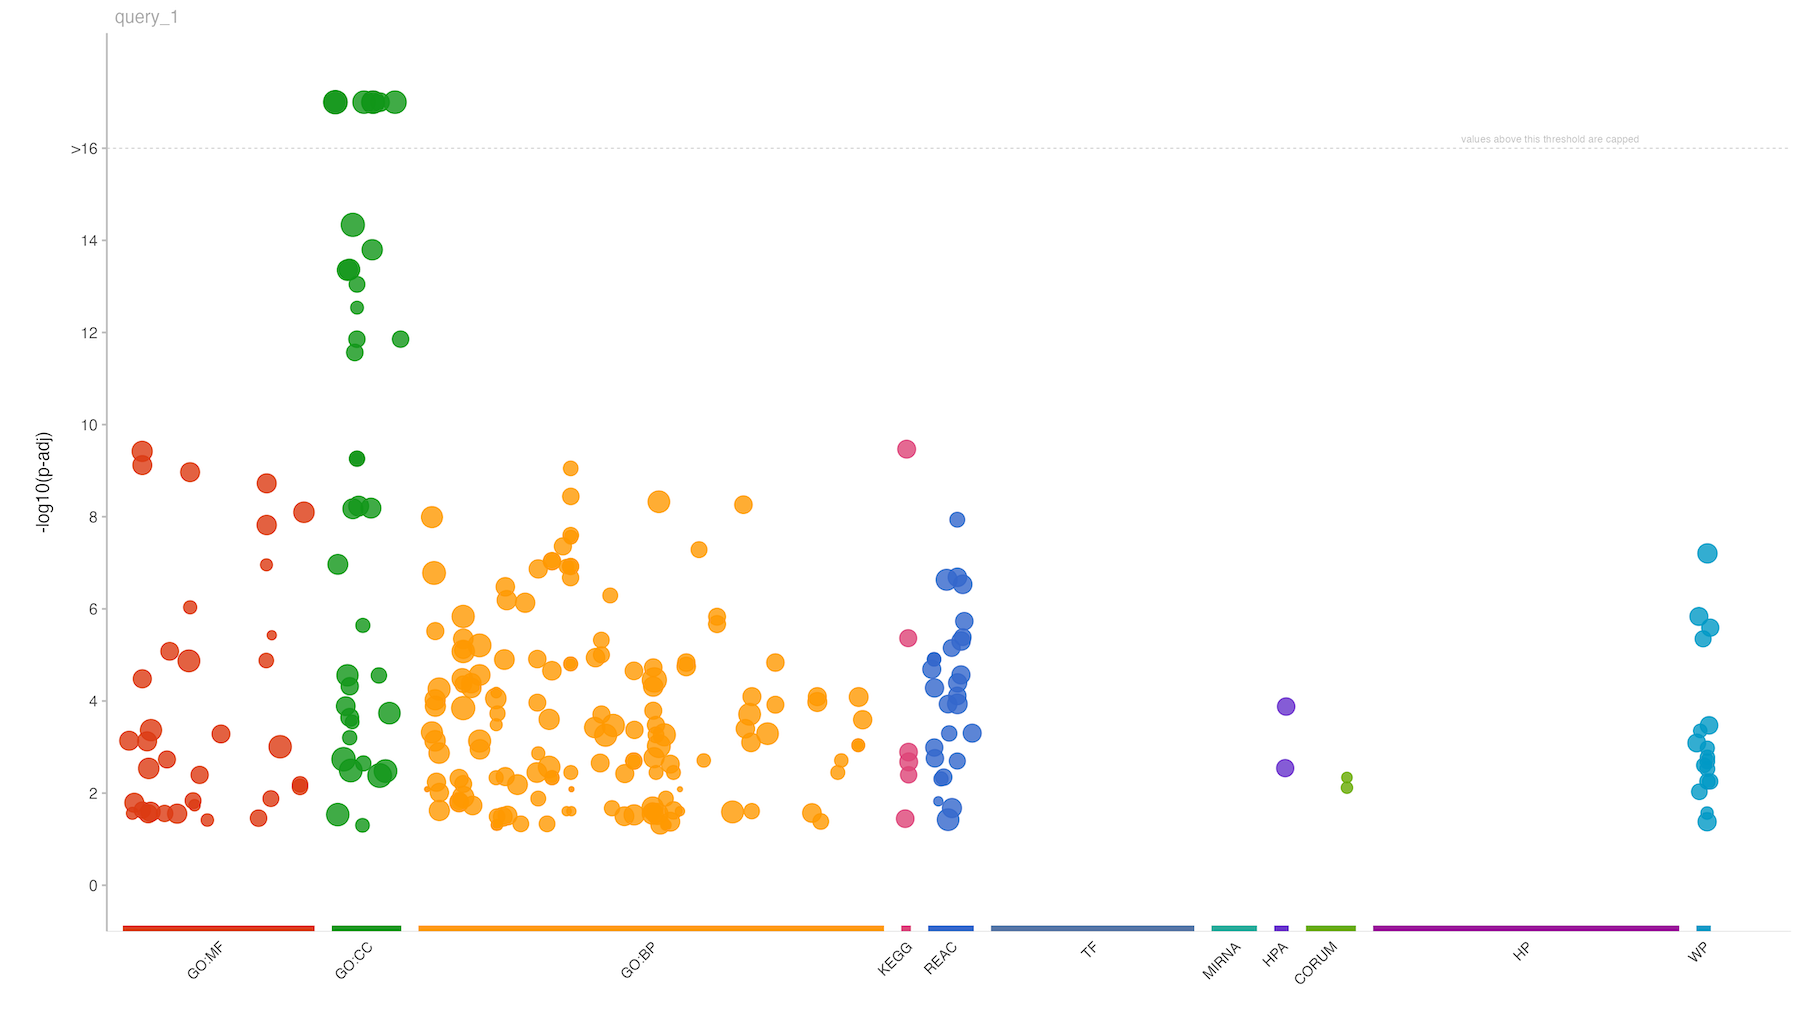
publish_gostplot(
p = gostplot(grpofiler_res, interactive = FALSE),
highlight_terms = NULL,
filename = paste0("gprofiler_query_Results/",str_replace_all(i,"/","_vs_"),"__plot.png"),
width = NA,
height = NA
)
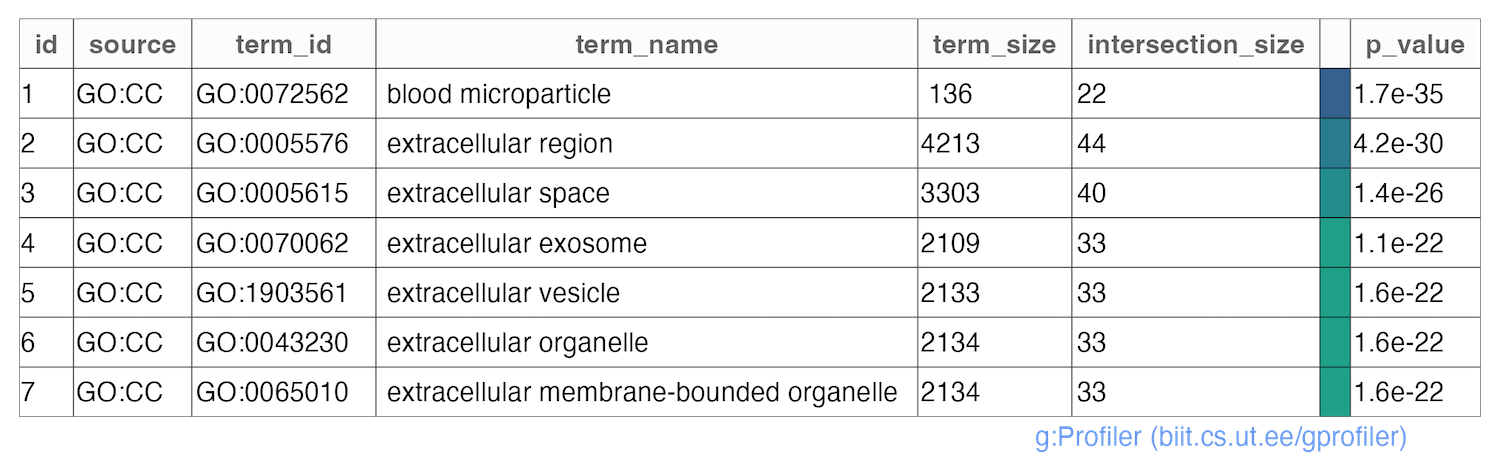
# write grpofiler results table
publish_gosttable(
gostres = grpofiler_res,
filename = paste0("gprofiler_query_Results/",str_replace_all(i,"/","_vs_"),"__table.png"),
highlight_terms = grpofiler_res$result$term_id[which(grpofiler_res$result$p_value<1E-16)]
)
}results
Upon execution of the above mentioned code, you will obtain a comprehensive functional enrichment analysis of the statistical results of SpectroPipeR. This analysis is encapsulated within a result container file (.rds), providing a robust and reusable data structure for further exploration. Additionally, the output includes a structured table and a visually compelling plot, offering both tabular and graphical representations of the analysis results.